Simulaite Report
Cannabinoid Nanoemulsion Pharmacokinetics
Capsoil 2025 clinical benchmark vs Formulaite PBPK simulation
June 25, 2026
Executive Summary
Formulaite simulated the same THC/CBD self-emulsified powder used in Hermush et al. (J Cannabis Res 7, 35 (2025)) and compared it to a tincture control matched to the study design. Reported PK metrics — bioavailability, Cmax, Tmax, AUC, and plasma concentration–time profiles — come directly from the Simulaite PBPK engine output for each virtual subject and are summarized across the cohort.
- Validation Takeaway
- Ratios below compare the nano powder arm to the tincture control in the same virtual cohort.
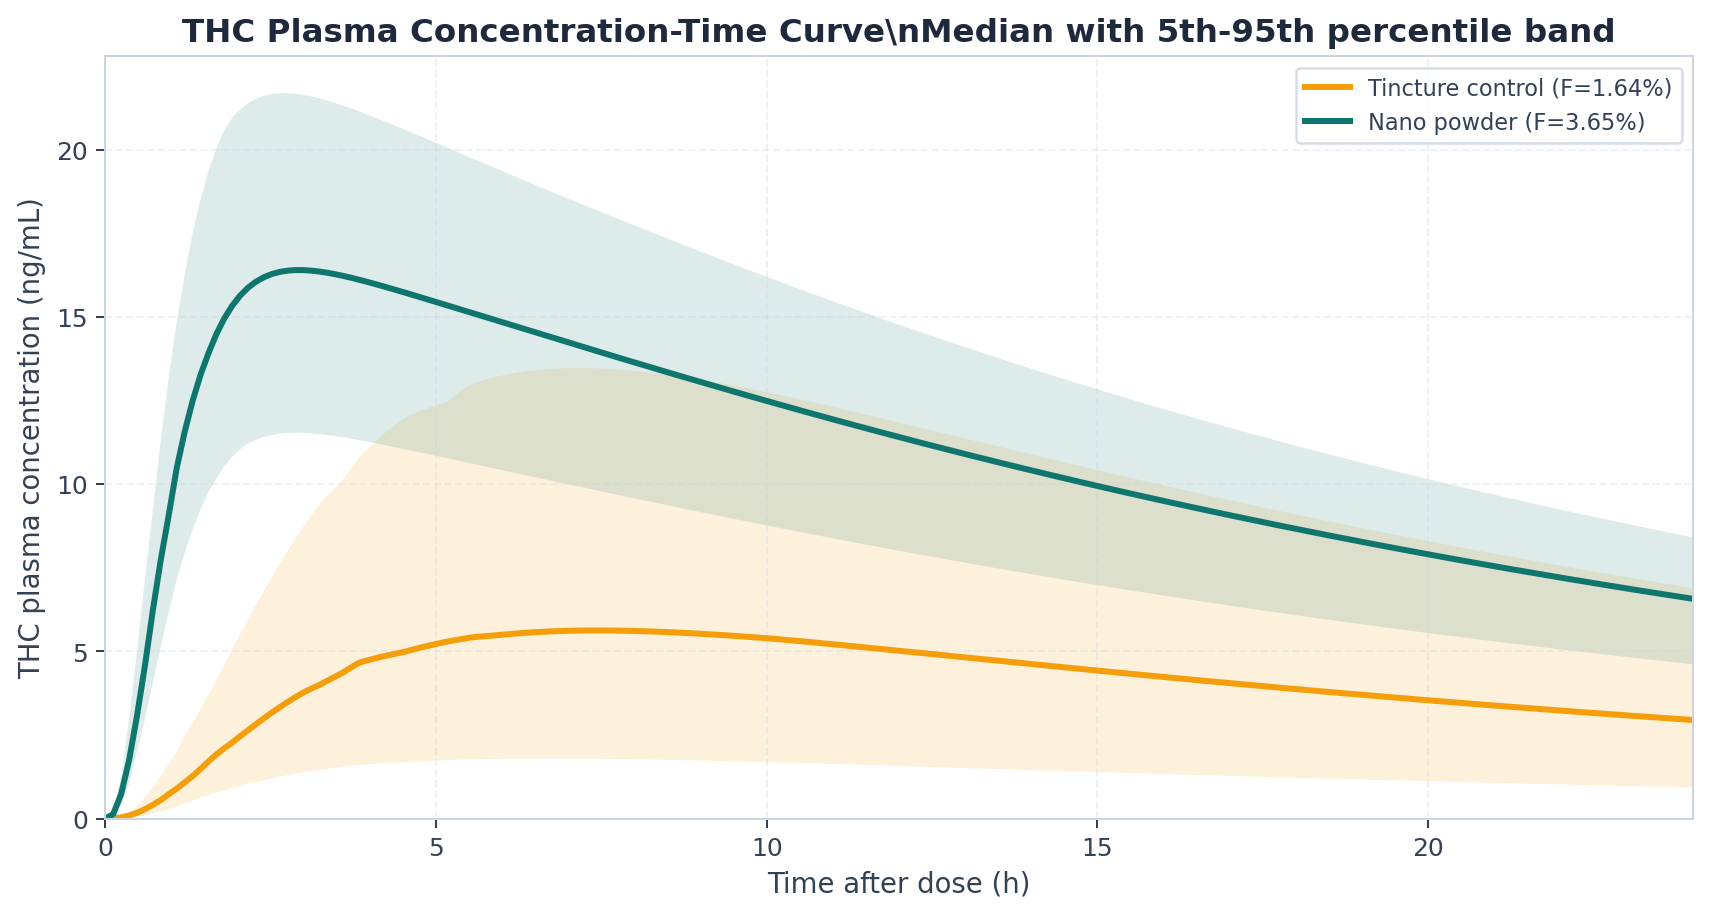
- THC: nano/control AUC ratio Simulaite 2.28× vs paper 2.86×; Simulaite Cmax ratio 2.49×.
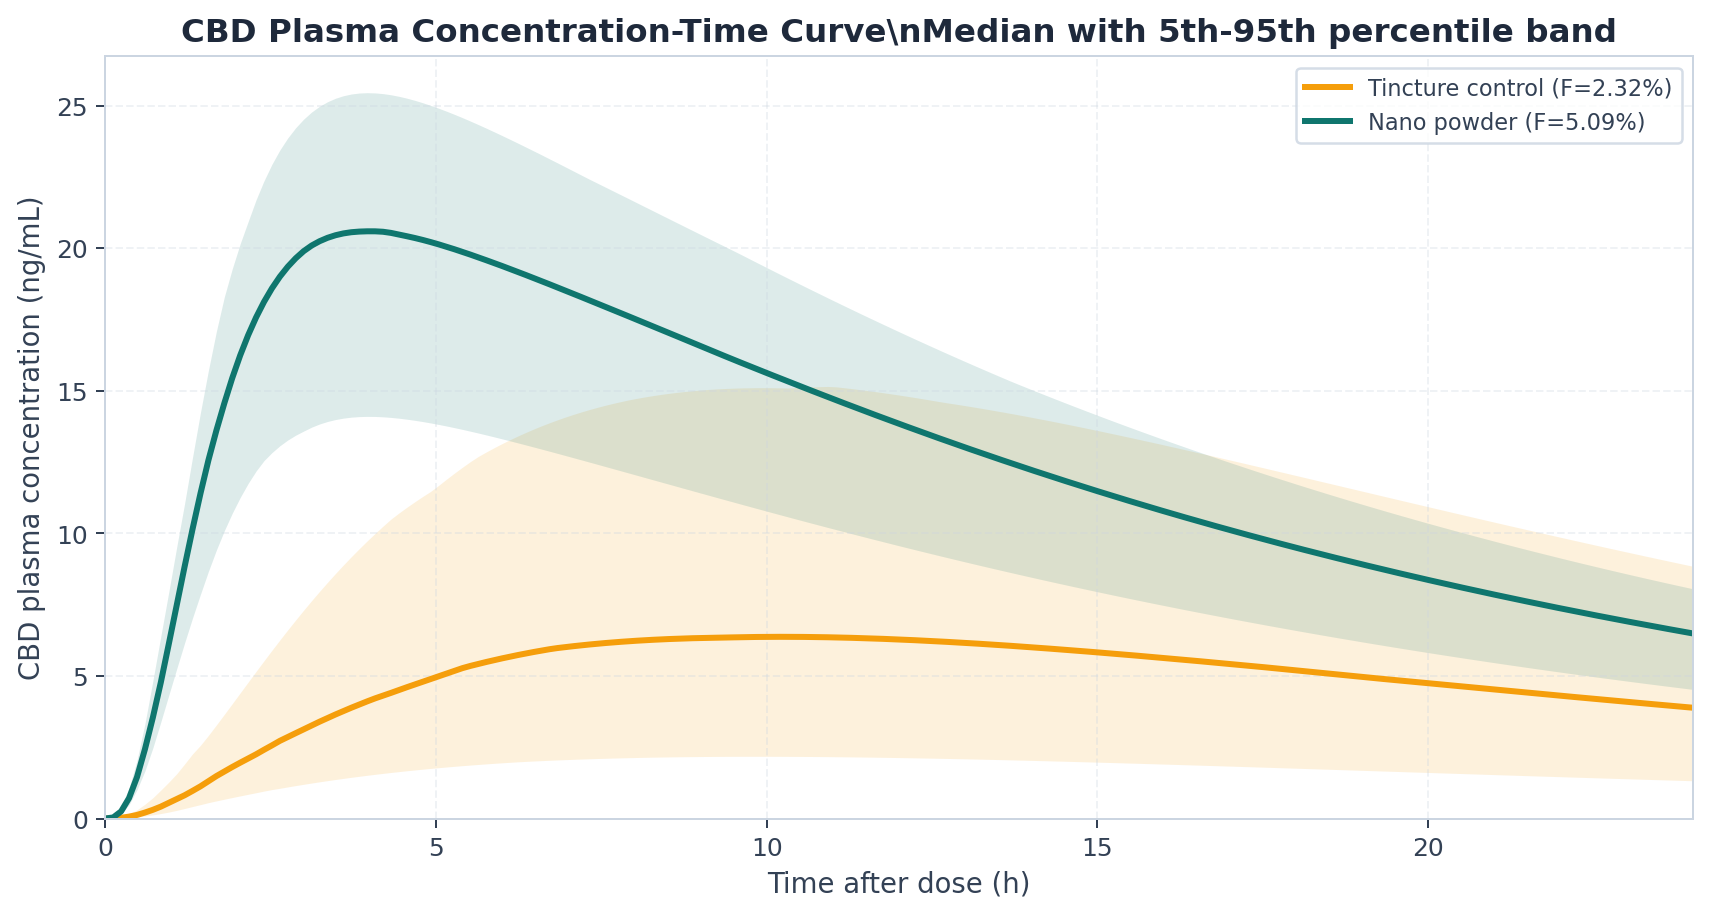
- CBD: nano/control AUC ratio Simulaite 2.26× vs paper 2.27×; Simulaite Cmax ratio 2.73×.
- The model captures the key clinical direction: nano powder is faster and gives roughly doubled AUC versus tincture control.
Molecules
| Name | SMILES |
|---|---|
| THC | CCCCCC1=CC(=C2[C@@H] 3 C=C(CC[C@H]3C(OC2=C 1 )(C)C)C)O |
| CBD | CCCCCC1=CC(=C(C(=C1) O )[C@@H]2C=C(CC[C@H] 2 C(=C)C)C)O |
We use our suite of graph neural networks to predict relevant molecular properties and interactions with liver enzymes, plasma proteins, and the gut wall to inform the simulations.
Formulations
1. Tincture control
- Oil tincture (MCT vehicle)
- Formulation type
- Active dose
- 8 mg THC + 8 mg CBD
- Vehicle oil
- Administration
80 mg medium-chain triglyceride oil
Short sublingual hold, remainder swallowed; fasted state
| Ingredient | Amount |
|---|---|
| Delta-9-tetrahydrocannabinol (THC) | 8.0 mg |
| Cannabidiol (CBD) | 8.0 mg |
| Ingredient | Amount |
|---|---|
| Medium-chain triglyceride (MCT) oil | 80.0 mg |
2. Capsoil self-emulsified nano powder
- Self-nanoemulsifying powder (oral)
- Formulation type
- Active dose
- 8 mg THC + 8 mg CBD per dose (matches Hermush et al. 2025)
- Post-redispersion D50
- In-use dilution
- Administration
- Powder redispersed in water, oral absorption; fasted state
158.0 nm after powder re-dispersion
250 mL total (125 mL reconstitution + 125 mL rinse)
| Delta-9-tetrahydrocannabinol (THC) | 8.0 mg |
| Cannabidiol (CBD) | 8.0 mg |
| Olive oil (lipid phase) | 45.0 mg |
| Polysorbate 80 (Tween 80) | 80.0 mg |
| Post-redispersion D50 | 158.0 nm |
| Reconstitution volume | 250 mL |
What happens after the powder is mixed
In the clinic, the powder is mixed with water before swallowing (125 mL reconstitution + 125 mL rinse in Hermush et al.). That forms a fine oil-in-water emulsion after re-dispersion (about 158.0 nm in the Hermush study) - the in-use product we model, not the dry powder on its own.
Droplet-size modeling: measured post-redispersion droplet size sets oil-water contact area; finer emulsions expose more surface and release cannabinoids from the oil phase sooner.
Colloidal partitioning: after reconstitution, the dose is split prospectively across immediately available gut fluid, surfactantstabilized colloid, and oil droplets, based on the product recipe and droplet size - not tuned to match the clinical curves.
Lipolysis: in the upper small intestine, we apply published lipid-digestion behavior (lipase and bile breaking down triglyceride droplets) to release drug from the oil core over time.
Solubilization and uptake: released cannabinoids partition between oil remnant, surfactant assemblies, and aqueous phase at the intestinal wall; lipophilic actives may also use lymphatic routes alongside digested lipids.
Population Settings
- Population
- American (with Census Demographics)
- American mixed proportional
- Population Type
- Sample Size (n)
- 100
- Age Range
- Female %
19–65 years (mean 43)
49% 47–135 kg (mean 79 kg)
- Weight
- Height
- BMI
- Race/Ethnicity
- Fasted
- Prandial State
- Simulation Duration
- 24 h
141–191 cm (mean 169 cm) 19–50 kg/m² (mean 28)
White 62% · Latino 19% · African American 13% · Asian 6%
The same virtual cohort was simulated independently under each formulation arm; differences reflect formulation modeling rather than subject composition.
PK Results
| Arm | Compound | F | Cmax | Tmax | AUC0-24 |
|---|---|---|---|---|---|
| Tincture control | THC | 1.64% | 6.64 ng/mL | 7.20 h | 116.43 ng·h/mL |
| Tincture control | CBD | 2.32% | 7.44 ng/mL | 10.20 h | 135.22 ng·h/mL |
| Nano powder | THC | 3.65% | 16.52 ng/mL | 2.88 h | 265.47 ng·h/mL |
| Nano powder | CBD | 5.09% | 20.33 ng/mL | 3.96 h | 305.85 ng·h/mL |
Clinical Relative Bioavailability Comparison
Hermush et al. (J Cannabis Res 7, 35 (2025)) reports the nano powder as 100% relative bioavailability, with the tincture control at 35% for THC and 44% for CBD. Therefore the clinical nano/control AUC ratios are 2.86× for THC and 2.27× for CBD.
| Compound | Paper oil relative BA | Paper nano/control AUC | Simulaite nano/control AUC0-24 | Delta |
|---|---|---|---|---|
| THC | 35% | 2.86× | 2.28× | -20.2% |
| CBD | 44% | 2.27× | 2.26× | -0.5% |
Plasma Concentration Curves
These plots are generated from formatter-backed production pk_profiles, using stored molecular-weight metadata for umol/L to ng/mL conversion.
Advanced Details (Predicted)
Enzyme contributions, P-gp substrate probability, and inhibition flags are ADMET model predictions — not clinically validated values.
Metabolic Clearance — Enzyme Contributions
| Compound | CYP1A2 | CYP3A4 | CYP2D6 | CYP2C9 | CYP2C19 | UGT1A1 | SULT1A1 | P-gp sub. |
|---|---|---|---|---|---|---|---|---|
| THC | — | 29.6% | 18.8% | 10.2% | — | 41.3% * | — | Yes |
| Compound | CYP1A2 | CYP3A4 | CYP2D6 | CYP2C9 | CYP2C19 | UGT1A1 | SULT1A1 | P-gp sub. |
|---|---|---|---|---|---|---|---|---|
| CBD | — | 28.3% | 18.8% | 11.5% | — | 41.4% * | — | Yes |
Enzyme Inhibition Profile
| Compound | CYP1A2 | CYP3A4 | CYP2D6 | CYP2C9 | CYP2C19 | UGT1A1 | SULT1A1 | P-gp inh. |
|---|---|---|---|---|---|---|---|---|
| THC | Yes | Yes | — | Yes | Yes | — | — | Yes |
| CBD | — | Yes | — | Yes | — | — | — | Yes |
Inhibition probability >=50% = inhibitor. Relevant for co-administration with CYP substrates.
Clinical benchmark reference: Vered Hermush, Nisim Mizrahi, Tal Brodezky, and Rafael Ezra. Enhancing cannabinoid bioavailability: a crossover study comparing a novel self-nanoemulsifying drug delivery system and a commercial oil-based formulation. J Cannabis Res 7, 35 (2025). DOI:
10.1186/s42238-025-00294-8. https://pmc.ncbi.nlm.nih.gov/articles/PMC12166629/
Pharmacokinetic Simulation Methodology
Simulaite Pharmacokinetics is a fully in silico physiologically based pharmacokinetic (PBPK) engine that predicts bioavailability directly from product specifications. ADMET properties are predicted using an ensemble of in-house graph neural networks trained on curated molecular, physicochemical, and bioactivity datasets. These predictions feed into a full compartmental PBPK framework taking into account lymphatic transport, transmucosal absorption, excipient-aware formulation modeling, and multicompound interactions. Population variability is represented using published demographically matched physiological statistics, enabling matched virtual cohort analysis.
For formulation comparisons, the same virtual cohort is simulated independently under each formulation, so differences reflect modeled formulation assumptions rather than differences in subject composition.
Selected Public PK Methodology References
1. Rowland M, Peck C, Tucker G. Physiologically-based pharmacokinetics in drug development and regulatory science. Annu Rev Pharmacol
Toxicol. 2011;51:45-73. doi:10.1146/annurev-pharmtox-010510-100540
2. Derendorf H, Schmidt S. Rowland and Tozer's Clinical Pharmacokinetics and Pharmacodynamics: Concepts and Applications. 5th ed. Wolters
Kluwer; 2019. ISBN 9781496385048
3. Amidon GL, Lennernäs H, Shah VP, Crison JR. A theoretical basis for a biopharmaceutic drug classification: the correlation of in vitro drug
product dissolution and in vivo bioavailability. Pharm Res. 1995;12(3):413-420. doi:10.1023/A:1016212804288
4. Noyes AA, Whitney WR. The rate of solution of solid substances in their own solutions. J Am Chem Soc. 1897;19:930-934. doi:10.1021/
5. Porter CJH, Trevaskis NL, Charman WN. Lipids and lipid-based formulations: optimizing the oral delivery of lipophilic drugs. Nat Rev Drug
Discov. 2007;6(3):231-248. doi:10.1038/nrd2197
6. Wieder O, Kohlbacher S, Kuenemann M, Garon A, Ducrot P, Seidel T, Langer T. A compact review of molecular property prediction with
graph neural networks. Drug Discovery Today: Technologies. 2020;37:1-12. doi:10.1016/j.ddtec.2020.11.009
7. Butler KT, Davies DW, Cartwright H, Isayev O, Walsh A. Machine learning for molecular and materials science. Nature.
2018;559(7715):547-555. doi:10.1038/s41586-018-0337-2