Simulaite Report
Curcuminoid Formulation Comparison
Crystalline Powder vs Hydrophilic Carrier ASD vs Phytosome — Relative Bioavailability
July 12, 2026
Executive Summary
We simulated oral bioavailability for three curcuminoid formulations — Crystalline Powder (1800 mg), Hydrophilic
Carrier ASD (376 mg), and Phytosome (376 mg) — using the Simulaite PBPK engine on a virtual population of 12 individuals matched to the clinical study by Jäger et al. 2014 in formulation composition, dose, demographics, and prandial state. Predicted relative bioavailability is benchmarked against the published clinical data.
Key Simulation Results
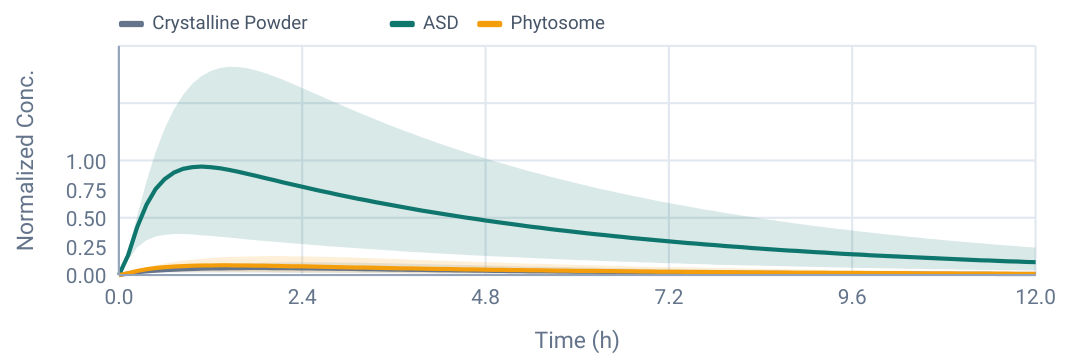
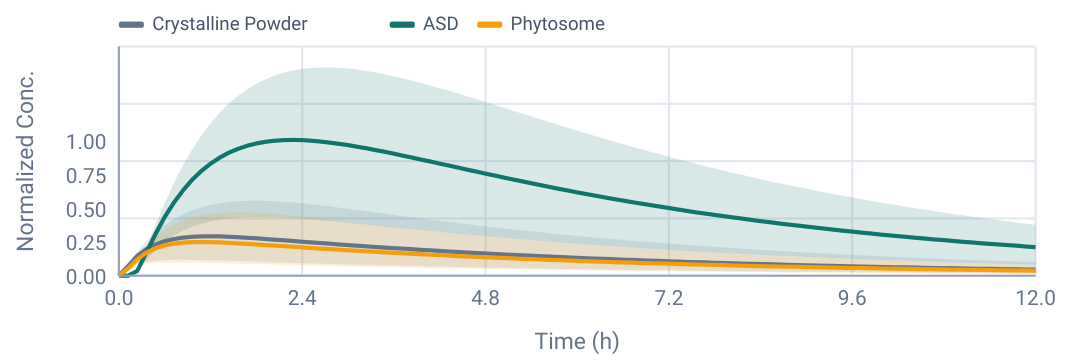
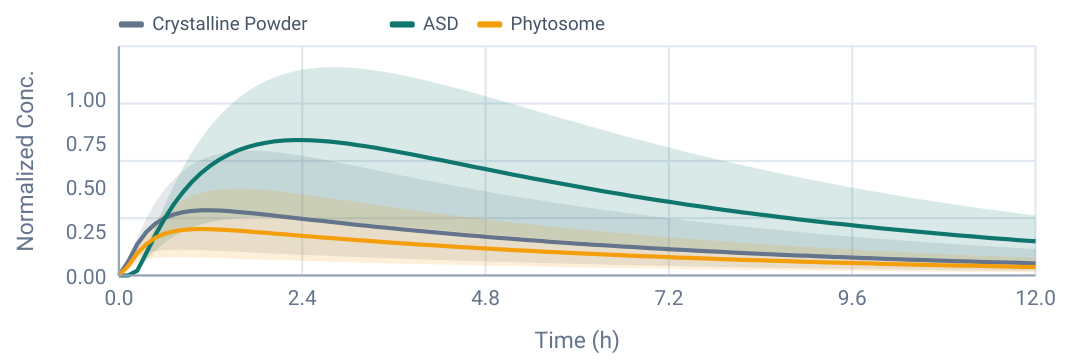
- Hydrophilic Carrier ASD: 54.2× more bioavailable than Crystalline Powder (dose-normalized blend AUC) — clinical: 45.9×
- Phytosome: 8.8× more bioavailable than Crystalline Powder — clinical: 7.9×
- ASD vs Phytosome: 6.1× advantage for ASD at equal dose — clinical: 5.8×
Molecules
Curcuminoids are polyphenolic pigments extracted from turmeric (Curcuma longa). Three principal compounds are present in the 77:17:6 ratio. All molecular properties are predicted from SMILES by our GNN suite — no experimental measurements are required.
| Compound | MW (g/mol) | Blend Ratio | SMILES |
|---|---|---|---|
| Curcumin | 368.4 | 77% | COC1=C(C=CC(=C1)/C=C/C(=O)CC(=O)/C=C/C2=CC(=C(C=C2)O)OC)O |
| Demethoxycurcumin (DMC) | 338.4 | 17% | COC1=C(C=CC(=C1)/C=C/C(=O)CC(=O)/C=C/C2=CC=C(C=C2)O)O |
| Bisdemethoxycurcumin (BDMC) | 308.3 | 6% | C1=CC(=CC=C1/C=C/C(=O)CC(=O)/C=C/C2=CC=C(C=C2)O)O |
All three curcuminoids display very low oral bioavailability from crystalline powder. Formulation technology is the primary lever for improving systemic exposure. We use our suite of graph neural networks to predict relevant molecular properties and interactions with liver enzymes, plasma proteins, and the gut wall to inform the simulations.
Simulation Study Design
| Parameter | Value |
|---|---|
| Prandial state | Fasted |
| Simulation window | 12 hours |
| Curcuminoid ratio | 77:17:6 (Curcumin:DMC:BDMC, C3 standard) |
| Validation reference | Jäger R et al. "Comparative absorption of curcumin formulations." Nutr J 2014, 13:11. PMID: 24461029. doi:10.1186/1475-2891-13-11 |
| Branded ingredients† | C3 Complex® (Sabinsa), CurcuWIN® (OmniActive), Meriva® (Indena) |
† Formulations modeled from publicly available patent and CoA data for branded ingredients — exact compositions are not published.
Virtual Population (matched to Jager 2014)
| Parameter | Value |
|---|---|
| n | 12 |
| Sex | 11M/1F (8.3% female) |
| Age | 18-28y (mean 23±2.4) |
| Weight | 77.8-94.6kg (mean 86.2±4.2) |
| Height | 170.7-195.1cm (mean 182.9±6.1) |
| Race | 11/12 Caucasian, 1/12 African American |
| Prandial state | fasted |
1. Crystalline Powder
- Delivery Type
- Oral capsule
- Route
- Oral (swallowed)
- Total dose
- 1800 mg curcuminoids
Particle size
Log-normal PSD: geomean=4.5 µm radius, GSD=2.44 (mass-weighted fit to CoA sieve data)
2. Hydrophilic Carrier ASD
- Delivery Type
- Oral capsule
- Route
- Oral (swallowed)
- Total dose
- 376 mg curcuminoids
- Polymer
- HPMC (hydroxypropyl methylcellulose)
- Lipid excipient
- Hydrogenated soybean oil (4.73% of dried solids)
- Drug loading
- 21.58% recipe-derived active-equivalent loading
3. Phytosome
- Delivery Type
- Oral capsule
- Route
- Oral (swallowed)
- Total dose
- 376 mg curcuminoids
- Phospholipid
- Soy phospholipids
- Ratio
- 1:4 turmeric-extract:soy-phospholipid input ratio
- Drug loading
- 18.76% recipe-derived active-equivalent loading
Bioavailability (F%) by Compound
Mean ± SD bioavailability for each curcuminoid across the three formulations (n=12, study-matched population).
| Compound | Crystalline Powder (1800 mg) | Hydrophilic Carrier ASD (376 mg) | Phytosome (376 mg) |
|---|---|---|---|
| Curcumin | 0.110% ± 0.080% | 6.370% ± 3.400% | 1.010% ± 0.600% |
| DMC | 0.200% ± 0.150% | 6.180% ± 3.350% | 1.340% ± 0.790% |
| BDMC | 0.370% ± 0.260% | 4.880% ± 2.700% | 1.830% ± 1.070% |
| Blend (77:17:6) | 0.141% ± 0.068% | 6.248% ± 2.684% | 1.115% ± 0.485% |
Relative Bioavailability — Blend (Dose-Normalized)
Dose-normalized blend AUC fold vs Crystalline Powder, weighted 77:17:6 (Curcumin:DMC:BDMC). Clinical values from Jager et al. 2014 (Relative Absorption column, already dose-normalized).
| Comparison | Predicted Fold | Predicted GCV | Clinical Fold (Jager 2014) | Pred/Clin Ratio |
|---|---|---|---|---|
| ASD vs Crystalline Powder | 54.2× | 55.8% | 45.9× | 1.18× |
| Phytosome vs Crystalline Powder | 8.8× | 61.8% | 7.9× | 1.12× |
| ASD vs Phytosome | 6.1× | 55.8% | 5.8× | 1.06× |
PK Timing and Relative Plasma Curves
Curcumin: Relative Plasma Concentration-Time Curve
DMC: Relative Plasma Concentration-Time Curve
BDMC: Relative Plasma Concentration-Time Curve
Metabolic Fingerprint
CYP and UGT enzyme contributions to total intrinsic clearance, plus P-glycoprotein efflux substrate status. Values are derived from our GNN suite predictions and integrated into the PBPK simulation. The GNN models predict substrate probability, intrinsic clearance per enzyme, and inhibition probability — all applied during simulation.
Substrate Profile — Enzymes & Transporters
Intrinsic clearance (CLint) fractions per compound, predicted by our GNN suite from molecular structure. Bold teal = dominant clearance enzyme.
| Compound | CYP1A2 | CYP3A4 | CYP2D6 | CYP2C9 | CYP2C19 | UGT1A1 | SULT1A1 | P-gp Efflux |
|---|---|---|---|---|---|---|---|---|
| Curcumin | — | 6.2% | 3.0% | 2.8% | — | 49.8% | 38.2% | Yes |
| DMC | — | 5.8% | 3.1% | 2.9% | — | 49.5% | 38.7% | Yes |
| BDMC | — | 5.4% | 3.1% | 2.9% | — | 49.3% | 39.3% | — |
Inhibition Profile — Enzymes & Transporters
Inhibition probabilities predicted by our GNN suite. Cross-compound DDI factors are computed from these values and applied during simulation.
| Compound | CYP1A2 | CYP3A4 | CYP2D6 | CYP2C9 | CYP2C19 | UGT1A1 | P-gp |
|---|---|---|---|---|---|---|---|
| Curcumin | Yes | — | — | Yes | Yes | — | Yes |
| DMC | Yes | — | — | Yes | Yes | — | — |
| BDMC | Yes | — | — | Yes | Yes | — | — |