Simulaite Report
Bioavailability Simulation — Fenugreek Extract + Shatavari Extract Capsule
Population-Level Pharmacokinetics for Menopausal Health
May 19, 2026
Executive Summary
We simulated oral bioavailability (F) for seven bioactive compounds across Fenugreek (500 mg) and Shatavari (300 mg) extracts using the Simulaite PBPK engine. Two fed-state Asian virtual populations were modeled: a general adult cohort (n=100, 50% female, ages 18-60y) and the target demographic, Menopausal Women age 45–55 (n=100, 100% female, ages 45-55y). The six-run matrix isolates compound baselines, extract self-DDI, and cross-extract PK interactions.
- Menopausal Women show lower systemic exposure across the full combined formulation; the mean saponin F shift is -16.9% relative to general adults.
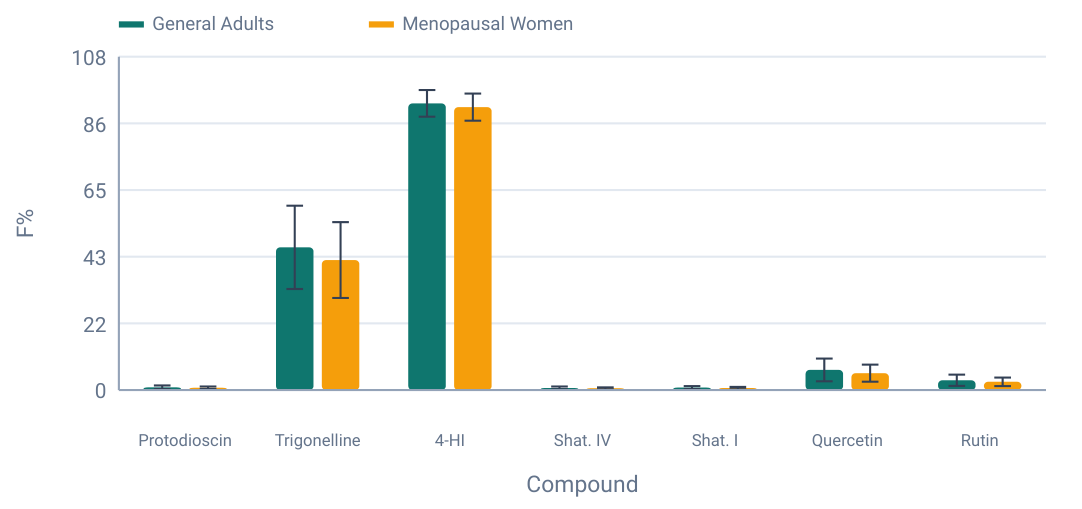
- Trigonelline stands out for Menopausal Women: high predicted bioavailability (42.1% F) plus reported picomolar phytoestrogen activity (Allred et al. (2009)).
- 4-Hydroxyisoleucine remains the most systemically available active: 92.9% F in general adults and 91.7% in Menopausal
Key Takeaways
Women.
- Saponin parent-compound exposure is low but non-zero: general combined-run F spans 0.70–0.91%; Menopausal Women spans 0.58–0.76%.
- Cross-extract DDI is still modest for saponins, but flavonoids respond: Quercetin rises 1.30× and Rutin rises 1.21× in the combined general-adult formulation versus Shatavari alone.
Molecules
| Name | Dose in Combined Capsule | MW g/ mol | SMILES |
|---|---|---|---|
| Protodioscin | 20.00 mg | 1049.2 | C[C@H]1[C@H]2[C@H](C[C@@H]3[C@@]2(CC[C@H]4[C@H]3CC=C5[C@@]4(CC[C@@H](C5)O[C@H]6[C@@H] ([C@H]([C@@H]([C@H](O6)CO)O[C@H]7[C@@H]([C@@H]([C@H]([C@@H](O7)C)O)O)O)O)O[C@H]8[C@@H] ([C@@H]([C@H]([C@@H](O8)C)O)O)O)C)C)O[C@@]1(CC[C@@H](C)CO[C@H]9[C@@H]([C@H]([C@@H]([C@H] (O9)CO)O)O)O)O |
| Trigonelline | 4.00 mg | 137.1 | C[N+]1=CC=CC(=C1)C(=O)[O-] |
| 4-Hydroxyisoleucine | 2.00 mg | 147.2 | C[C@H]([C@@H](C(=O)O)N)C(C)O |
| Shatavarin IV | 21.00 mg | 887.1 | C[C@H]1CC[C@@]2([C@H]([C@H]3[C@@H] (O2)C[C@@H]4[C@@]3(CC[C@H]5[C@H]4CC[C@H]6[C@@]5(CC[C@@H](C6)O[C@H]7[C@@H]([C@H]([C@@H] ([C@H](O7)CO)O[C@H]8[C@@H]([C@@H]([C@H]([C@@H](O8)C)O)O)O)O)O[C@H]9[C@@H]([C@H]([C@@H]([C@H] (O9)CO)O)O)O)C)C)C)OC1 |
| Shatavarin I | 9.00 mg | 1067.2 | C[C@H]1[C@H]2[C@H](C[C@@H]3[C@@]2(CC[C@H]4[C@H]3CC[C@H]5[C@@]4(CC[C@@H](C5)O[C@H]6[C@@H] ([C@H]([C@@H]([C@H](O6)CO)O[C@H]7[C@@H]([C@@H]([C@H]([C@@H](O7)C)O)O)O)O)O[C@H]8[C@@H]([C@H] ([C@@H]([C@H](O8)CO)O)O)O)C)C)O[C@@]1(CC[C@H](C)CO[C@H]9[C@@H]([C@H]([C@@H]([C@H] (O9)CO)O)O)O)O |
| Quercetin | 1.50 mg | 302.2 | C1=CC(=C(C=C1C2=C(C(=O)C3=C(C=C(C=C3O2)O)O)O)O)O |
| Rutin | 1.20 mg | 610.5 | C[C@H]1[C@@H]([C@H]([C@H]([C@@H](O1)OC[C@@H]2[C@H]([C@@H]([C@H]([C@@H] (O2)OC3=C(OC4=CC(=CC(=C4C3=O)O)O)C5=CC(=C(C=C5)O)O)O)O)O)O)O)O |
We use our suite of graph neural networks to predict relevant molecular properties and interactions with liver enzymes, plasma proteins, and the gut wall to inform the simulations.
Extracts
Fenugreek Extract (500 mg)
| Molecule | Standardization |
|---|---|
| Protodioscin | 4% |
| Molecule | Standardization |
|---|---|
| Trigonelline | 0.8% |
| 4-Hydroxyisoleucine | 0.4% |
Shatavari Extract (300 mg)
| Molecule | Standardization |
|---|---|
| Shatavarin IV | 7% |
| Shatavarin I | 3% |
| Quercetin | 0.5% |
| Rutin | 0.4% |
Formulations
- Protodioscin Alone
- Delivery Type
- Capsule
- Subtype
- Powder
- Protodioscin Dose
- Particle Radius Mean
- 50.0 µm
- Shatavarin-IV Alone
- Delivery Type
- Capsule
- Subtype
- Powder
- Shatavarin IV Dose
- Particle Radius Mean
- 50.0 µm
- Protodioscin + Shatavarin-IV Pair
- Delivery Type
- Capsule
- Subtype
- Powder
- Protodioscin Dose
- Shatavarin IV Dose
- 21 mg
- Particle Radius Mean
- 50.0 µm
- Fenugreek Extract (Full)
- Delivery Type
- Capsule
- Subtype
- Powder
- Fenugreek Extract Dose
- Particle Radius Mean
- 50.0 µm
- Shatavari Extract (Full)
- Delivery Type
- Capsule
- Subtype
- Powder
- Shatavari Extract Dose
- Particle Radius Mean
- 50.0 µm
- Fenugreek + Shatavari Combined
- Delivery Type
- Capsule
- Subtype
- Powder
- Fenugreek Extract Dose
- Shatavari Extract Dose
- 300 mg
- Particle Radius Mean
- 50.0 µm
20 mg
21 mg
20 mg
500 mg
300 mg
500 mg
Population Settings
| Parameter | General Population | Menopausal Women |
|---|---|---|
| Ethnicity | Asian | Asian |
| Sample Size | 100 | 100 |
| Sex | 50 female, 50 male | 100 female, 0 male |
| Age Range | 18.1–59.7 y (mean 40.3) | 45.1–55.0 y (mean 50.2) |
| Body Weight | 40.2–75.4 kg (mean 56.1) | 38.3–97.9 kg (mean 51.6) |
| Parameter | General Population | Menopausal Women |
|---|---|---|
| Height | 139.5–184.0 cm (mean 161.5) | 141.2–166.7 cm (mean 151.8) |
| BMI Range | 16.8–30.2 (mean 21.5) | 17.1–43.5 (mean 22.4) |
| Prandial State | Fed | Fed |
Simulation Design — 6-Run Comparison Matrix
Each population ran the same six-scenario matrix to isolate single-compound baselines, pair DDI, extract self-DDI, and full cross-extract DDI.
| Run | Scenario | # Compounds | Purpose |
|---|---|---|---|
| #1 | Protodioscin alone | 1 | Isolated baseline |
| #2 | Shatavarin-IV alone | 1 | Isolated baseline |
| #3 | Proto + Shat-IV pair | 2 | Pair DDI |
| #4 | Fenugreek extract | 3 | Extract self-DDI |
| #5 | Shatavari extract | 4 | Extract self-DDI |
| #6 | Fenugreek + Shatavari combined | 7 | Full formulation |
Bioavailability Results
- Combined Formulation F% Plot
- Full formulation bioavailability by compound. Bars compare the general adult reference population against Menopausal Women;
error bars show ±1 SD.
- Per-Compound Bioavailability — General Population
- Asian, 50% female, ages 18–60, fed state. Evaluable n range: 99–100.
| Compound | Alone (#1, #2) | #3 Pair | #4 Fenugreek | #5 Shatavari | #6 Combined |
|---|---|---|---|---|---|
| Protodioscin | 0.90 ± 0.55% | 0.91 ± 0.56% | 0.91 ± 0.56% | — | 0.91 ± 0.56% |
| Trigonelline | — | — | 46.20 ± 13.51% | — | 46.23 ± 13.51% |
| 4-Hydroxyisoleucine | — | — | 92.90 ± 4.33% | — | 92.90 ± 4.33% |
| Shatavarin IV | 0.69 ± 0.42% | 0.69 ± 0.42% | — | 0.69 ± 0.42% | 0.70 ± 0.43% |
| Shatavarin I | — | — | — | 0.80 ± 0.49% | 0.81 ± 0.49% |
| Quercetin | — | — | — | 5.02 ± 2.93% | 6.52 ± 3.66% |
| Rutin | — | — | — | 2.63 ± 1.52% | 3.19 ± 1.82% |
- Per-Compound Bioavailability — Menopausal Women
- Asian, 100% female, fed state. Age range defined in Population Settings.
| Compound | Alone (#1, #2) | #3 Pair | #4 Fenugreek | #5 Shatavari | #6 Combined |
|---|---|---|---|---|---|
| Protodioscin | 0.75 ± 0.41% | 0.75 ± 0.41% | 0.76 ± 0.41% | — | 0.76 ± 0.41% |
| Trigonelline | — | — | 42.21 ± 12.28% | — | 42.13 ± 12.29% |
| 4-Hydroxyisoleucine | — | — | 91.69 ± 4.40% | — | 91.65 ± 4.40% |
| Shatavarin IV | 0.58 ± 0.31% | 0.58 ± 0.31% | — | 0.58 ± 0.31% | 0.58 ± 0.32% |
| Shatavarin I | — | — | — | 0.67 ± 0.37% | 0.67 ± 0.37% |
| Quercetin | — | — | — | 4.22 ± 2.18% | 5.48 ± 2.77% |
| Compound | Alone (#1, #2) | #3 Pair | #4 Fenugreek | #5 Shatavari | #6 Combined |
|---|---|---|---|---|---|
| Rutin | — | — | — | 2.19 ± 1.15% | 2.67 ± 1.41% |
Population Delta — Combined Formulation
| Compound | General F% | Menopausal Women F% | Relative Δ | General CV | Women CV |
|---|---|---|---|---|---|
| Protodioscin | 0.91 ± 0.56% | 0.76 ± 0.41% | -16.5% | 62% | 54% |
| Trigonelline | 46.23 ± 13.51% | 42.13 ± 12.29% | -8.9% | 29% | 29% |
| 4-Hydroxyisoleucine | 92.90 ± 4.33% | 91.65 ± 4.40% | -1.3% | 5% | 5% |
| Shatavarin IV | 0.70 ± 0.43% | 0.58 ± 0.32% | -17.1% | 61% | 55% |
| Shatavarin I | 0.81 ± 0.49% | 0.67 ± 0.37% | -17.3% | 60% | 55% |
| Quercetin | 6.52 ± 3.66% | 5.48 ± 2.77% | -16.0% | 56% | 51% |
| Rutin | 3.19 ± 1.82% | 2.67 ± 1.41% | -16.3% | 57% | 53% |
PK Parameter Table — Combined Formulation
AUC is oral AUC over the simulated 24 h horizon, calculated from individual plasma curves and converted to ng/mL·h using each compound molecular weight from the result JSON. Cmax is ng/mL; Tmax is hours.
| Compound | Pop. | AUC ng/mL·h | AUC CV | Cmax ng/mL | Tmax h | F% |
|---|---|---|---|---|---|---|
| Protodioscin | Gen. | 3172.3 ± 1862.5 | 59% | 5.25 ± 3.15 | 3.36 ± 0.20 | 0.91 ± 0.56 |
| Menopaus al | 2689.3 ± 1446.8 | 54% | 4.41 ± 2.41 | 3.38 ± 0.18 | 0.76 ± 0.41 | |
| Trigonelline | Gen. | 8421.6 ± 2407.7 | 29% | 65.03 ± 19.75 | 0.85 ± 0.16 | 46.23 ± 13.51 |
| Menopaus al | 7778.5 ± 2258.9 | 29% | 60.26 ± 18.53 | 0.85 ± 0.16 | 42.13 ± 12.29 | |
| 4-Hydroxyisoleucine | Gen. | 33128.5 ± 3649.5 | 11% | 73.15 ± 9.96 | 1.93 ± 0.45 | 92.90 ± 4.33 |
| Menopaus al | 33184.2 ± 4365.0 | 13% | 72.12 ± 11.10 | 2.04 ± 0.45 | 91.65 ± 4.40 | |
| Shatavarin IV | Gen. | 4270.4 ± 2502.1 | 59% | 4.17 ± 2.57 | 8.12 ± 1.26 | 0.70 ± 0.43 |
| Menopaus al | 3663.7 ± 1973.2 | 54% | 3.55 ± 1.95 | 8.41 ± 1.24 | 0.58 ± 0.32 | |
| Shatavarin I | Gen. | 1130.8 ± 661.9 | 59% | 2.03 ± 1.17 | 2.98 ± 0.13 | 0.81 ± 0.49 |
| Menopaus al | 958.9 ± 519.4 | 54% | 1.71 ± 0.96 | 2.98 ± 0.13 | 0.67 ± 0.37 | |
| Quercetin | Gen. | 2530.1 ± 1351.2 | 53% | 3.57 ± 1.93 | 4.45 ± 0.21 | 6.52 ± 3.66 |
| Menopaus al | 2173.0 ± 1076.4 | 50% | 3.05 ± 1.54 | 4.47 ± 0.20 | 5.48 ± 2.77 | |
| Rutin | Gen. | 248.7 ± 135.7 | 55% | 0.85 ± 0.49 | 1.91 ± 0.18 | 3.19 ± 1.82 |
| Compound | Pop. | AUC ng/mL·h | AUC CV | Cmax ng/mL | Tmax h | F% |
|---|---|---|---|---|---|---|
| Menopaus al | 212.4 ± 109.4 | 52% | 0.73 ± 0.37 | 1.91 ± 0.18 | 2.67 ± 1.41 |
Cross-Extract DDI Analysis — General Population
| Compound | Alone | Own Extract | Combined | Combined / Own |
|---|---|---|---|---|
| Protodioscin | 0.90% | 0.91% | 0.91% | 1.00× |
| Trigonelline | — | 46.20% | 46.23% | 1.00× |
| 4-Hydroxyisoleucine | — | 92.90% | 92.90% | 1.00× |
| Shatavarin IV | 0.69% | 0.69% | 0.70% | 1.01× |
| Shatavarin I | — | 0.80% | 0.81% | 1.01× |
| Quercetin | — | 5.02% | 6.52% | 1.30× |
| Rutin | — | 2.63% | 3.19% | 1.21× |
The n=100 results show minimal cross-extract PK enhancement for saponins. Quercetin and Rutin increase more clearly in the combined extract, consistent with UGT1A1 interaction and extract context, but this does not rescue parent saponin exposure.
Plasma Concentration–Time Profiles — Combined Formulation
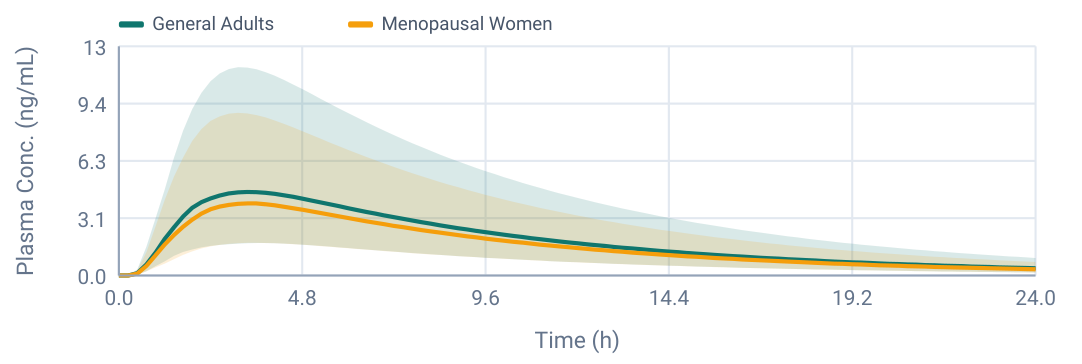
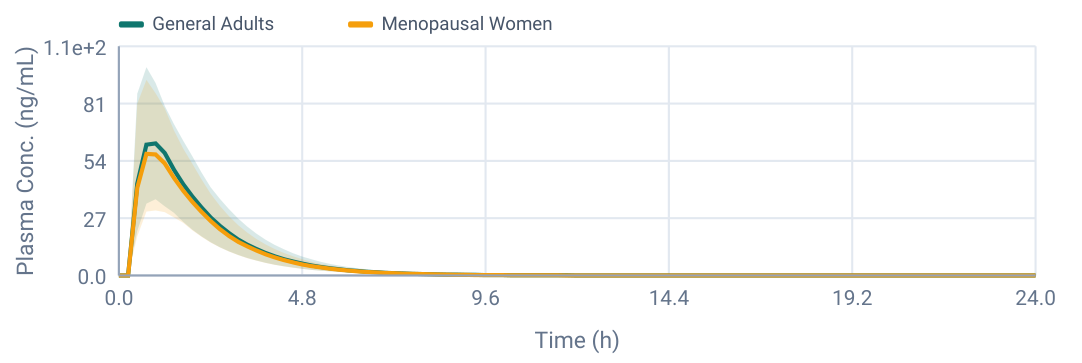
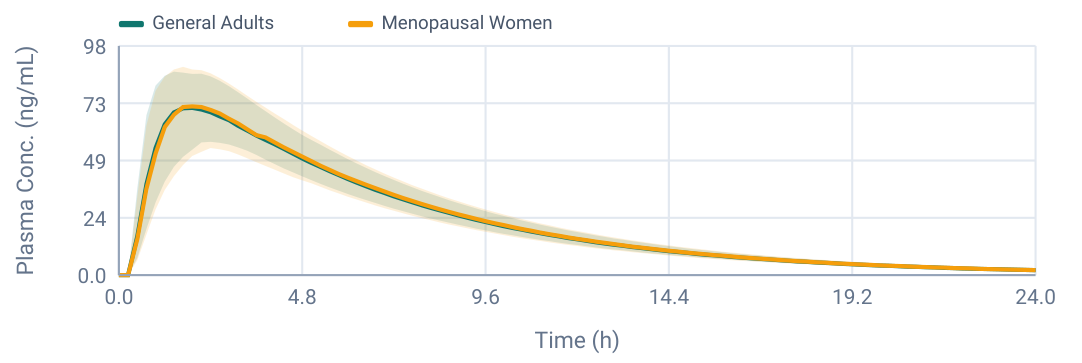
Median plasma concentration-time profiles for the full combined extract formulation with P5–P95 uncertainty bands.
Protodioscin: Plasma Concentration-Time Curve
Trigonelline: Plasma Concentration-Time Curve
4-Hydroxyisoleucine: Plasma Concentration-Time Curve
Shatavarin IV: Plasma Concentration-Time Curve
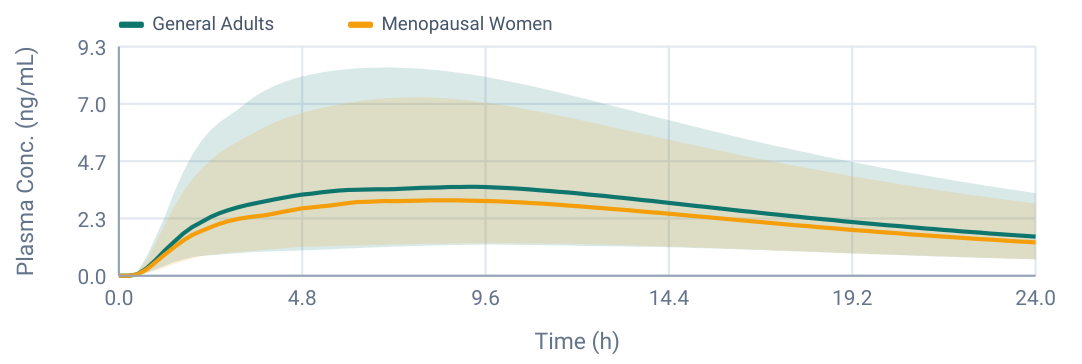
Shatavarin I: Plasma Concentration-Time Curve
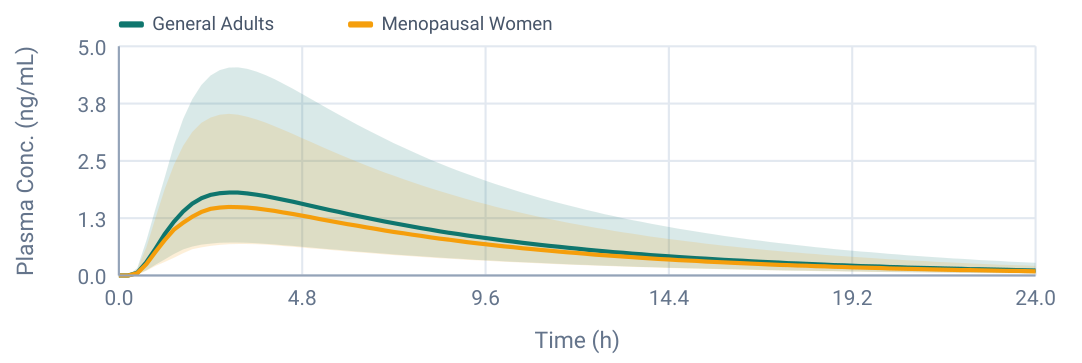
Quercetin: Plasma Concentration-Time Curve
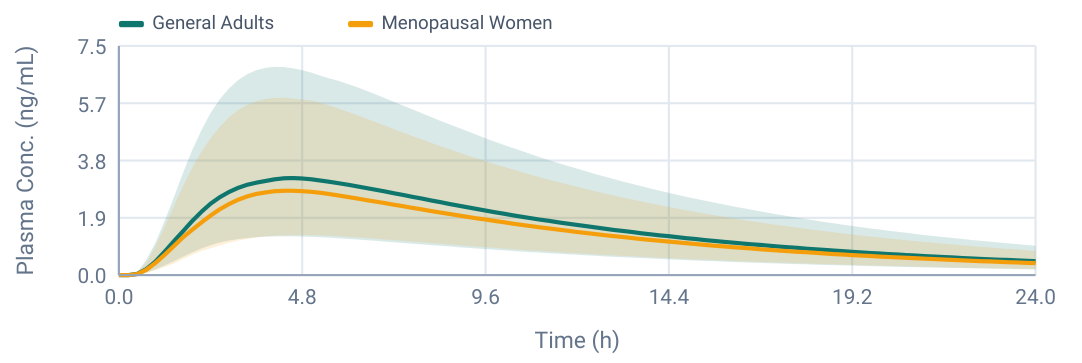
Rutin: Plasma Concentration-Time Curve
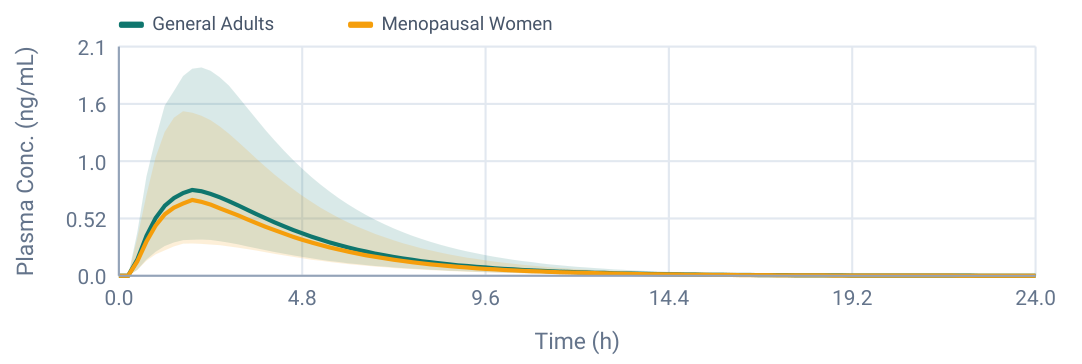
Metabolic Fingerprint
CYP and UGT enzyme contributions to total intrinsic clearance, plus P-glycoprotein efflux substrate status. Values are derived from our GNN suite predictions and integrated into the PBPK simulation. The GNN models predict substrate probability, intrinsic clearance per enzyme, and inhibition probability — all applied during simulation.
Substrate Profile — Enzymes & Transporters
Intrinsic clearance (CLint) fractions per compound, predicted by our GNN suite from molecular structure. Bold teal = dominant clearance enzyme.
| Compound | CYP1A2 | CYP3A4 | CYP2D6 | CYP2C9 | CYP2C19 | UGT1A1 | SULT1A1 | P-gp Efflux |
|---|---|---|---|---|---|---|---|---|
| Protodioscin | — | 41.5% | 5.9% | — | — | 52.6% | — | Yes |
| Trigonelline | — | 29.7% | 22.2% | 20.8% | — | 27.3% | — | — |
| 4-Hydroxyisoleucine | — | — | — | — | — | — | — | — |
| Shatavarin IV | — | 35.1% | 7.4% | — | — | 57.4% | — | Yes |
| Shatavarin I | — | 35.2% | 5.1% | — | — | 59.7% | — | Yes |
| Quercetin | — | 0.3% | 0.1% | 0.2% | — | 50.0% | 49.4% | — |
| Rutin | — | 0.6% | 0.2% | — | — | 50.2% | 49.1% | — |
Inhibition Profile — Enzymes & Transporters
Inhibition probabilities predicted by our GNN suite. Cross-compound DDI factors are computed from these values and applied during simulation.
| Compound | CYP1A2 | CYP3A4 | CYP2D6 | CYP2C9 | CYP2C19 | UGT1A1 | P-gp |
|---|---|---|---|---|---|---|---|
| Protodioscin | — | — | — | — | — | — | — |
| Trigonelline | Yes | — | — | — | — | — | — |
| 4-Hydroxyisoleucine | — | — | — | — | — | — | — |
| Shatavarin IV | — | — | — | — | — | — | — |
| Shatavarin I | — | — | — | — | — | — | — |
| Quercetin | Yes | — | — | — | — | Yes | — |
| Rutin | — | — | — | — | — | Yes | — |
- UGT1A1 glucuronidation remains the dominant modeled pathway for saponins and flavonoids.
- 4-Hydroxyisoleucine is handled as an amino-acid-like molecule with effectively zero CYP/UGT clearance, supporting its high
Metabolic Insights
F%.
- Saponins are modeled as P-gp substrates with very low permeability, explaining high variability and low parent exposure.
- Quercetin and Rutin inhibit UGT1A1 in the model; their co-formulation increases flavonoid exposure more than saponin exposure.