Simulaite Report
Resveratrol Buccal Strip Bioavailability
Pharmacokinetic Simulation Compared to Clinical Case Study
July 12, 2026
Executive Summary
We simulated oral bioavailability (F) for resveratrol comparing two delivery methods — a buccal mucoadhesive strip
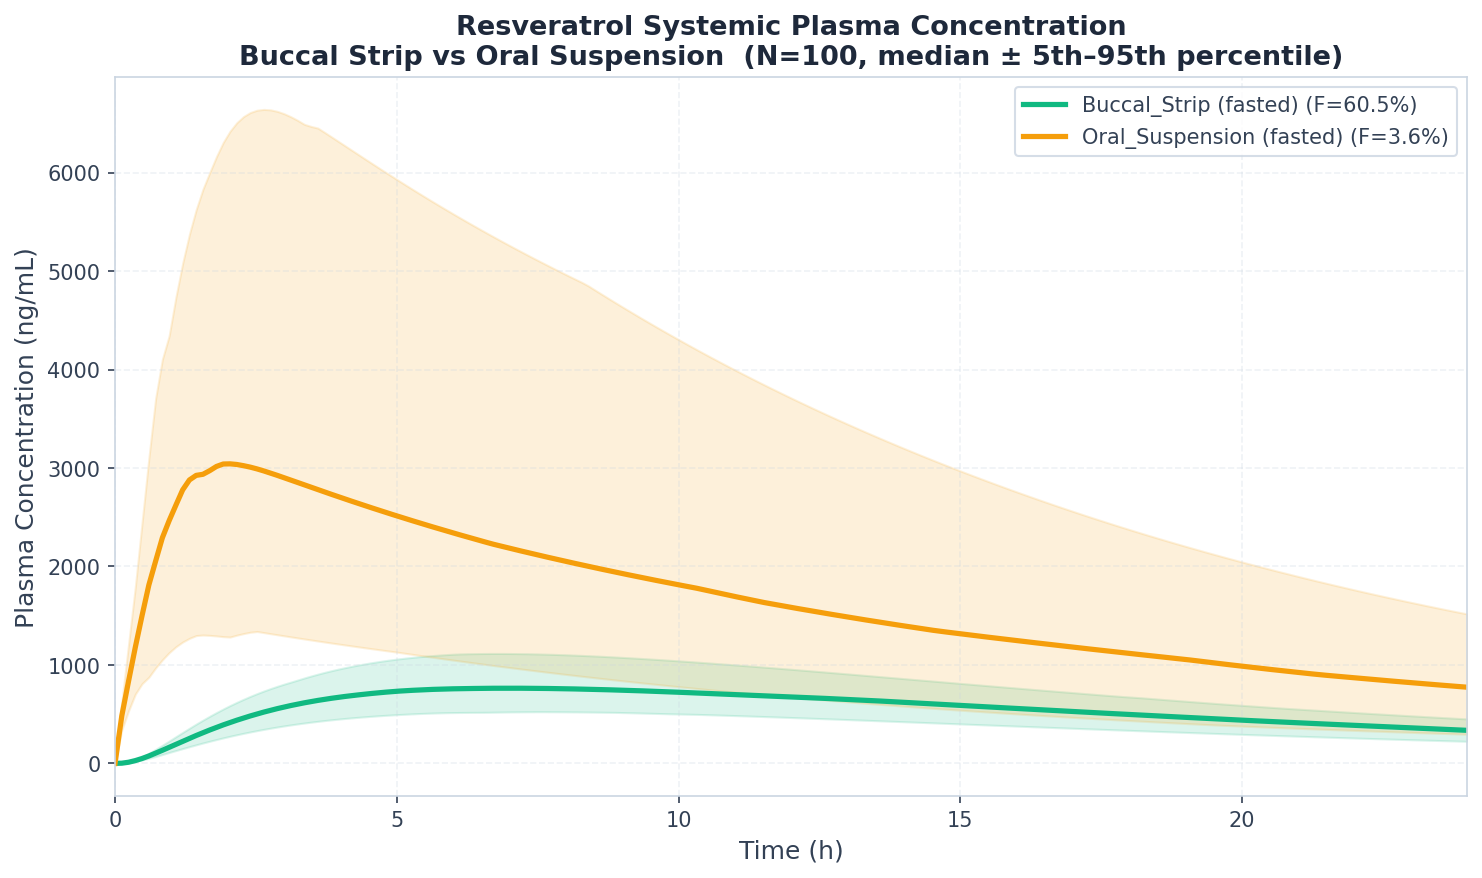
(34 mg, 9 h continuous release) and an oral powder suspension in water (2000 mg) — using the Simulaite PBPK engine on a virtual population of 100 American individuals. Our population-level predictions (n=100) extend the findings from Bojanowski et al. (2015, https://doi.org/10.14283/jarcp.2015.70) who performed an n=1 clinical case study using the same formulation parameters. Both the clinical observation and our simulation demonstrate that transbuccal delivery provides substantially higher early systemic exposure by bypassing first-pass metabolism — on the paper's 2 h endpoint (% dose in blood), our model predicts a 13.3× buccal advantage vs ~15× observed clinically.
- Buccal strip achieves 21.5% bioavailability vs 0.5% for oral powder suspension — a 42× enhancement
- On dose-normalized exposure at 2 h, our model predicts a 13.3× buccal advantage — very similar to the ~15× observed clinically by Bojanowski et al. (2015)
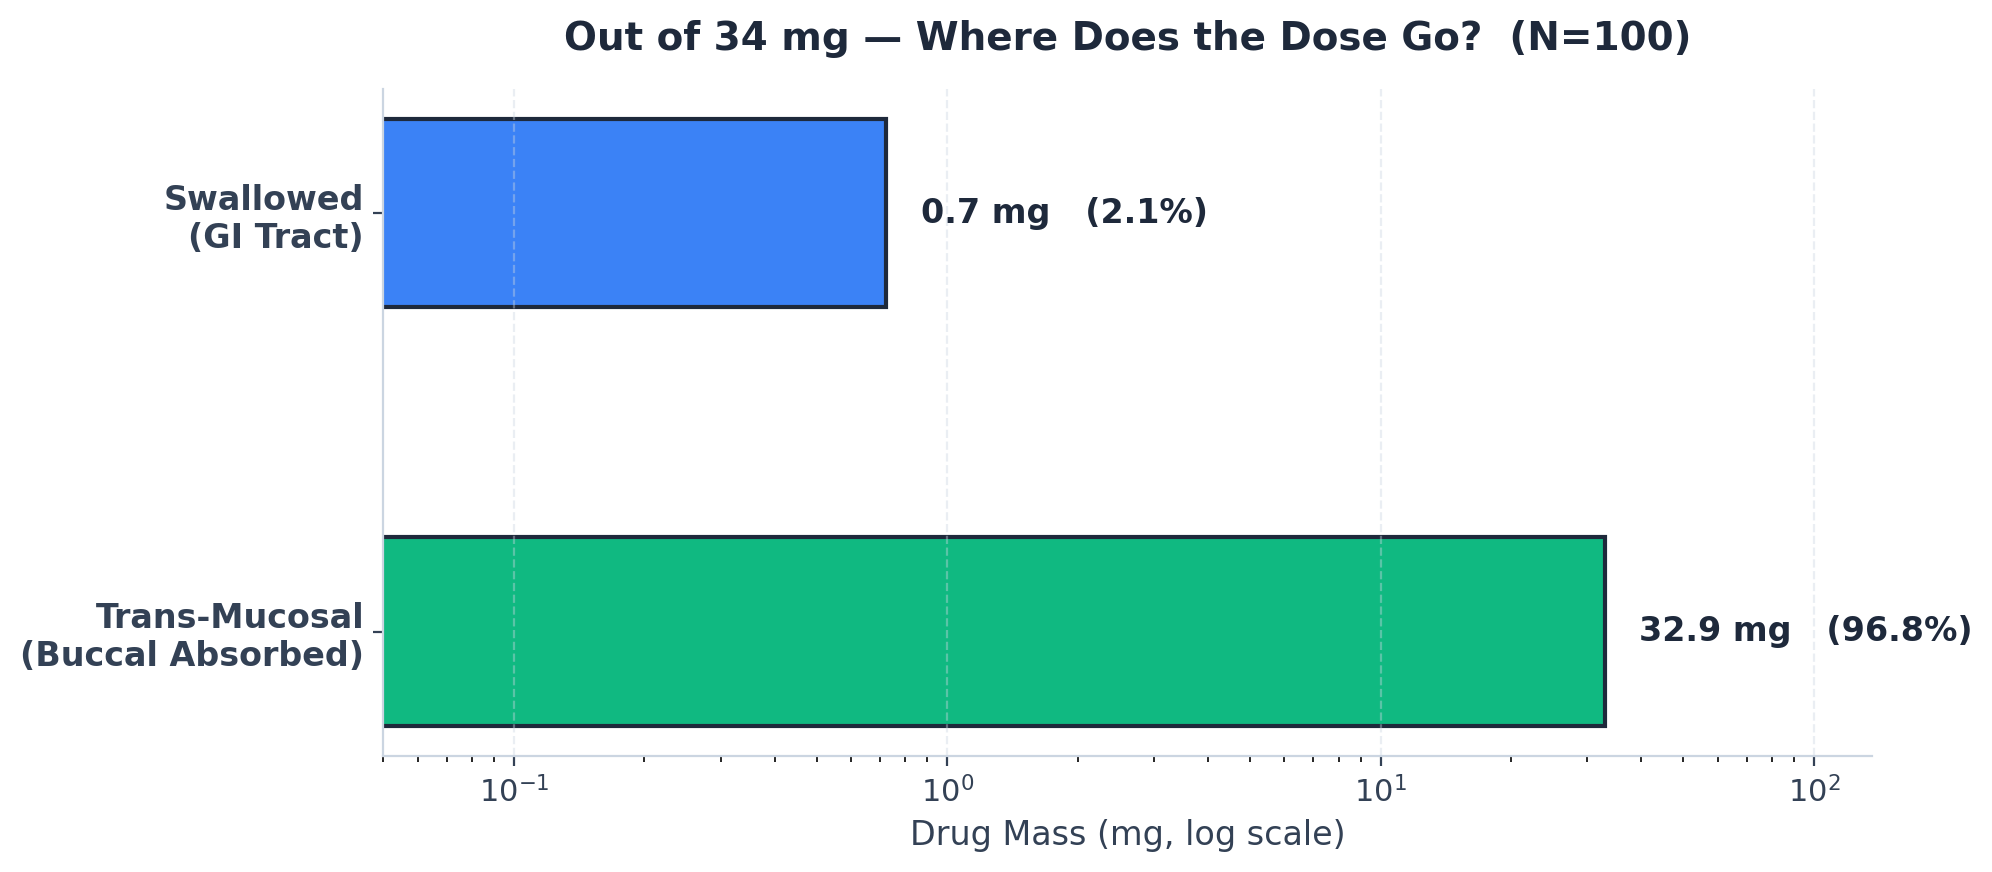
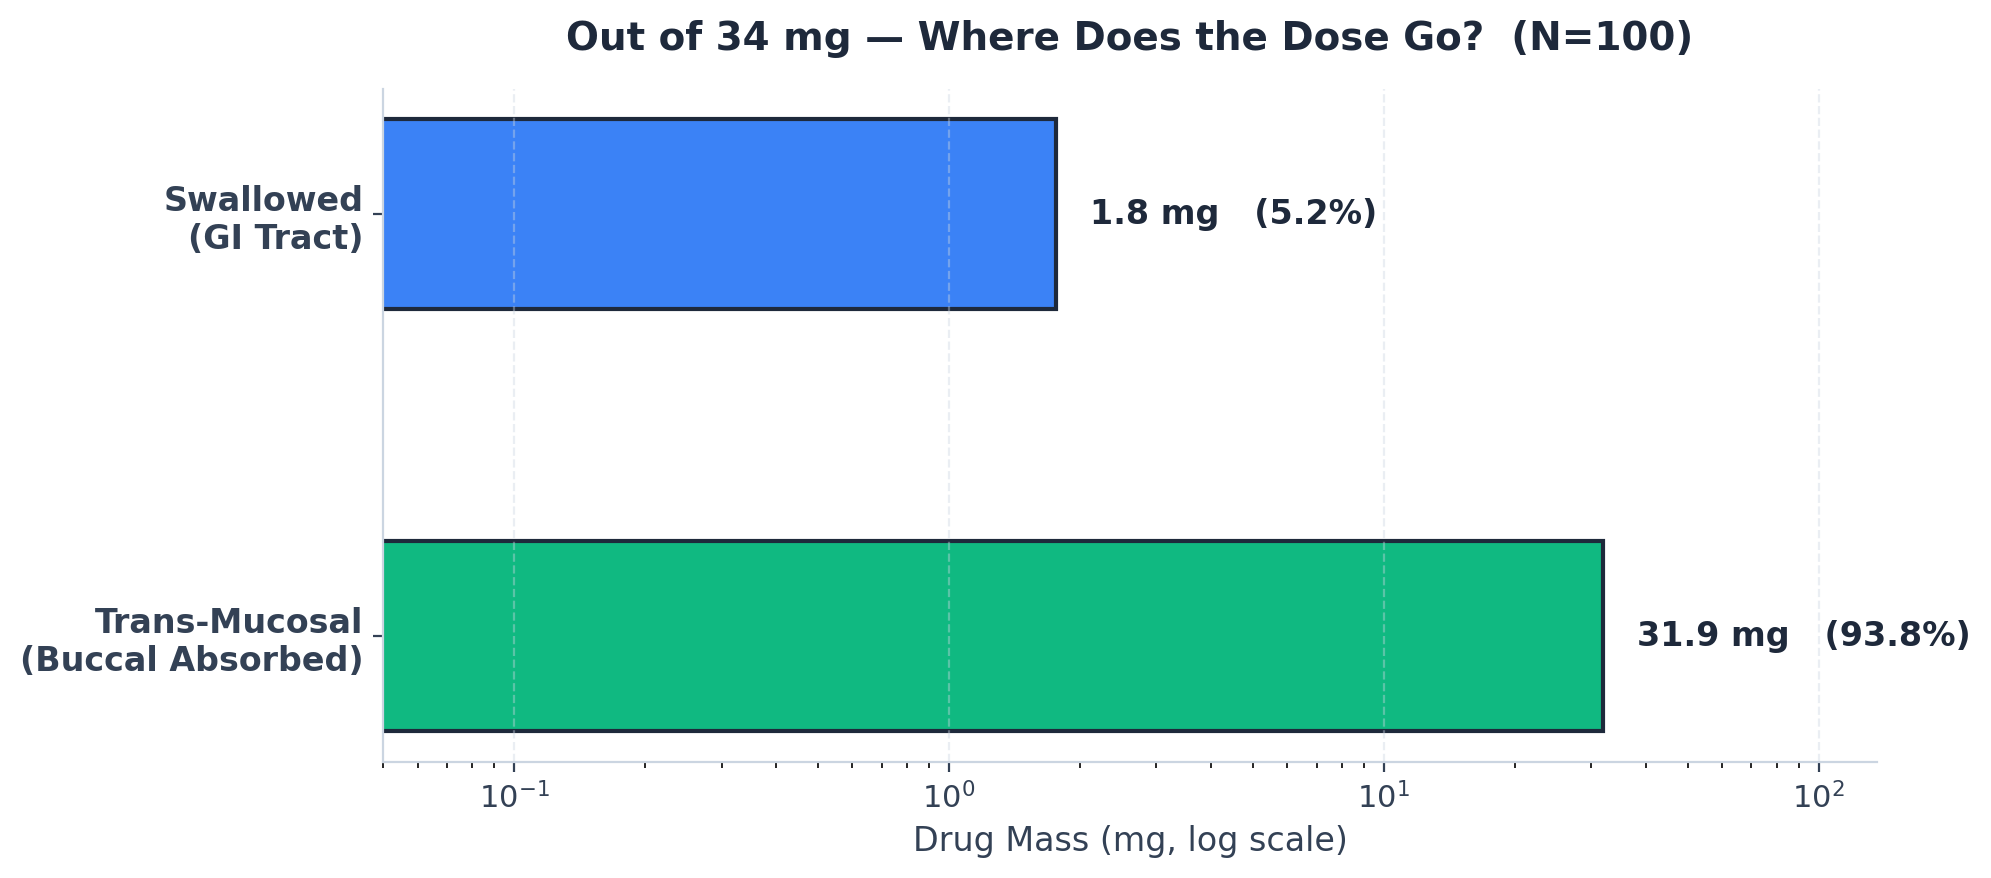
- 93.8% of administered dose is absorbed transmucosally; 5.2% is swallowed (negligible GI contribution)
- Inter-individual variability is much lower for buccal (CV=14%) vs oral (CV=78%)
- Sustained release (Tmax=10.3 h) provides prolonged systemic exposure vs sharp spike (Tmax=3.8 h) for oral
Key Takeaways
Molecule
Enzyme Substrate Profile, Inhibition
| Name | SMILES | MW (g/ mol) | Formula |
|---|---|---|---|
| Resveratrol | C1=CC(=CC=C1/C=C/C2=CC(=CC(=C2)O)O)O | 228.247 | — |
Resveratrol is a polyphenolic stilbenoid with poor oral bioavailability due to extensive first-pass metabolism. We use our suite of graph neural networks to predict relevant molecular properties and interactions with liver enzymes, plasma proteins, and the gut wall to inform the simulations.
Formulation Parameters
The simulation parameters exactly match the Bojanowski et al. (2015, https://doi.org/10.14283/jarcp.2015.70) clinical study, enabling direct validation of our PBPK model against clinical evidence.
1. Buccal Strip (Trans-Mucosal)
- Delivery Type
- Oral Strip
- Subtype
- CMC Mucoadhesive
- Dose
- 34 mg
- Strip Dimensions
- 3.5 × 4 cm (14 cm²)
- Polymer
- Carboxymethylcellulose (CMC)
- Delivery Duration
- 9 hours continuous
2. Oral Suspension (GI)
- Delivery Type
- Liquid
- Subtype
- Suspension
- Dose
- 2000 mg
- Particle PSD
- Lognormal geomean 80 µm, GSD 2.0
Population Settings
A virtual population of 100 American individuals was generated using population physiology from pharmaceutical databases. Each individual has unique organ volumes, blood flows, and enzyme expression levels derived from clinical datasets. The population captures inter-individual variability in absorption, distribution, and clearance.
| Parameter | Value |
|---|---|
| Sample Size (n) | 100 |
| Sex | 49% female, 51% male |
| Age Range | 18.9–63.8 years (mean 40.4) |
| Body Weight | 42.8–127.8 kg (mean 77.5) |
| BMI Range | 17.2–45.7 (mean 27.1) |
| Ethnicity | White 62% · Latino 19% · African American 13% · Asian 6% |
| Prandial State | Fasted |
Bioavailability Results
| Parameter | Buccal Strip | Oral Suspension | Fold Change |
|---|---|---|---|
| C @ 2 h (ng/mL) | 66.2 | 292.6 | — (dose confounded) |
| % dose in blood @ 2 h | 0.91% | 0.07% | 13.3× |
| C @ 2 h per mg dose (ng/mL/mg) | 1.95 | 0.15 | 13.3× |
| Bioavailability (F%) | 21.5 ± 3.1% | 0.5 ± 0.4% | 42.2× |
| Cmax (ng/mL) | 278.1 | 350.3 | — |
| Tmax (h) | 10.3 | 3.8 | 2.7× (sustained) |
| Parameter | Buccal Strip | Oral Suspension | Fold Change |
|---|---|---|---|
| GCV of 2 h endpoint (%) | 38.8% | 62.7% | 1.6× less variable |
Buccal Absorption Dynamics
Drug transit through buccal tissue layers over the 9-hour delivery period. The streamgraph shows drug distribution in saliva, epithelium, and submucosa as a percentage of administered dose.
- Saliva pool peaks within the first hour (~12% of dose); drug then redistributes into epithelium over 1–3 h (epithelial loading peaks ~3 h, ~22% of dose)
- Submucosa receives drug continuously via concentration-driven diffusion, feeding systemic circulation and bypassing gutwall and hepatic first-pass metabolism
- Sustained release maintains plasma levels for 6-8 hours post-dose
- Mechanistic Insight
- Where does the 34 mg dose go? Our simulation tracks drug mass through each absorption pathway.
| Pathway | Mass (mg) | % of Dose |
|---|---|---|
| Trans-Mucosal (Buccal Absorbed) | 31.89 | 93.8% |
| Swallowed (GI Tract) | 1.76 | 5.2% |
| Remaining on Strip | 0.35 | 1.0% |
Clinical Validation: Bojanowski et al. (2015)
Reference: Bojanowski, K. & Bojanowski, R. "Two methods of oral delivery of resveratrol: A case study." Journal of Aging Research
& Clinical Practice, 2015. https://doi.org/10.14283/jarcp.2015.70
Study Parameters (Exact Match to Our Simulation)
| Parameter | Bojanowski Clinical Study | Our PBPK Simulation |
|---|---|---|
| Subject | 74yo male | n=100, 18-65y, 50% F |
| Buccal Dose | 34 mg | 34 mg |
| Strip size | 3.5 × 4 cm (14 cm²) | 3.5 × 4 cm (14 cm²) |
| Duration | 9 hours | 9 hours |
| Polymer | CMC mucoadhesive | CMC mucoadhesive modeled |
| Oral Dose | 2 g powder | 2 g powder |
Key Findings Comparison
| Metric | Bojanowski (n=1) | Simulaite (n=100) |
|---|---|---|
| % dose in blood @ 2 h | 0.61% vs 0.04% (~15×) | 0.91% vs 0.07% (13.3×) |
- Validation Conclusion
- Our PBPK simulation predicts a 13.3× advantage for transbuccal delivery on the same endpoint Bojanowski used — fraction
of dose present in blood at 2 h — closely matching their ~15× clinical observation. This validates Simulaite's oral strip modeling: we reproduce the early systemic exposure advantage from bypassing first-pass metabolism.
Note: Absolute plasma concentration at 2 h is higher for the 2000 mg oral suspension than the 34 mg strip because of the large dose difference. Bojanowski and our model both compare dose-normalized blood exposure (% of administered dose in circulation), which is the appropriate validation metric.
Metabolic Fingerprint
CYP, UGT, and SULT enzyme contributions to total intrinsic clearance, plus P-glycoprotein efflux substrate status.
Values are compound properties derived from GNN predictions and integrated into the PBPK simulation. Substrate and inhibition magnitude is also predicted by our GNN suite and applied during simulation (not shown).
Substrate Profile — Enzymes & Transporters
Intrinsic clearance (CLint) fractions per compound. Bold teal = dominant clearance enzyme.
| Compound | CYP1A2 | CYP3A4 | CYP2D6 | CYP2C9 | CYP2C19 | UGT1A1 | SULT1A1 | P-gp Efflux |
|---|---|---|---|---|---|---|---|---|
| Resveratrol | 0.0% | 1.3% | 1.0% | 0.9% | 0.0% | 49.7% | 47.1% | — |
Inhibition Profile — Enzymes & Transporters
| Compound | CYP1A2 | CYP3A4 | CYP2D6 | CYP2C9 | CYP2C19 | UGT1A1 | SULT1A1 | P-gp |
|---|---|---|---|---|---|---|---|---|
| Resveratrol | Yes | Yes | — | — | — | — | — | — |